Guide forAnalytics dashboard →
Dashboard and reports
Read your revenue, profit, stock value and tax in Retailed's dashboard, and build your own set of report cards.
The dashboard is the first page you see. It answers three questions: how much is my stock worth, how much did I make, and what needs my attention today.
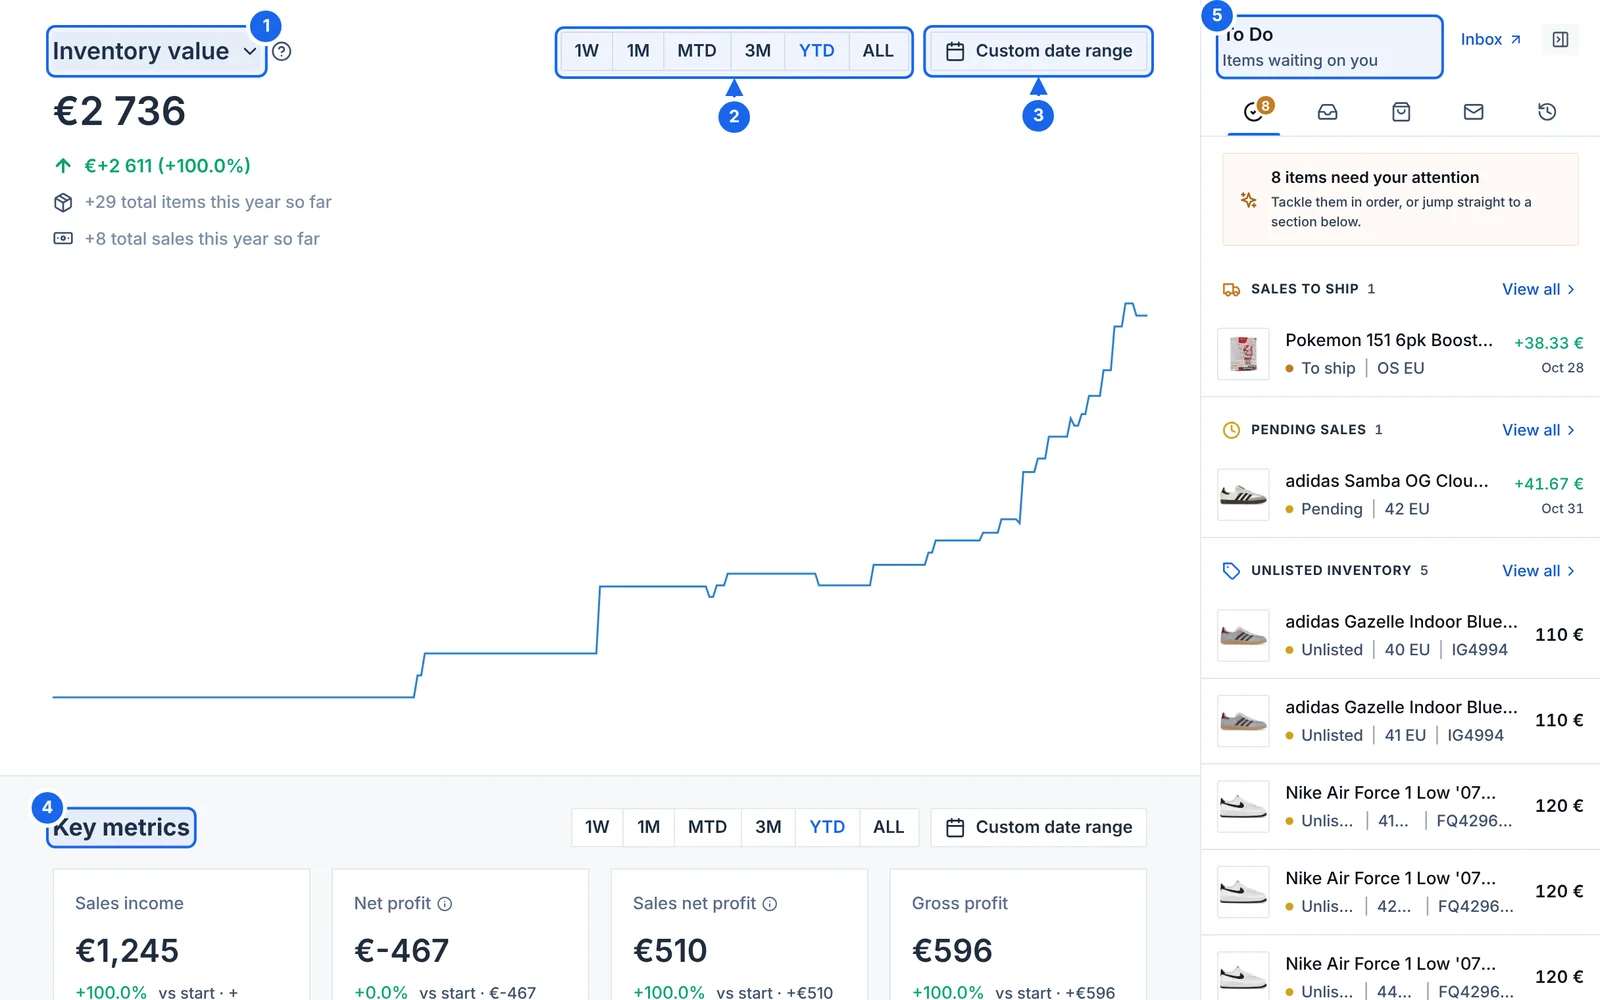
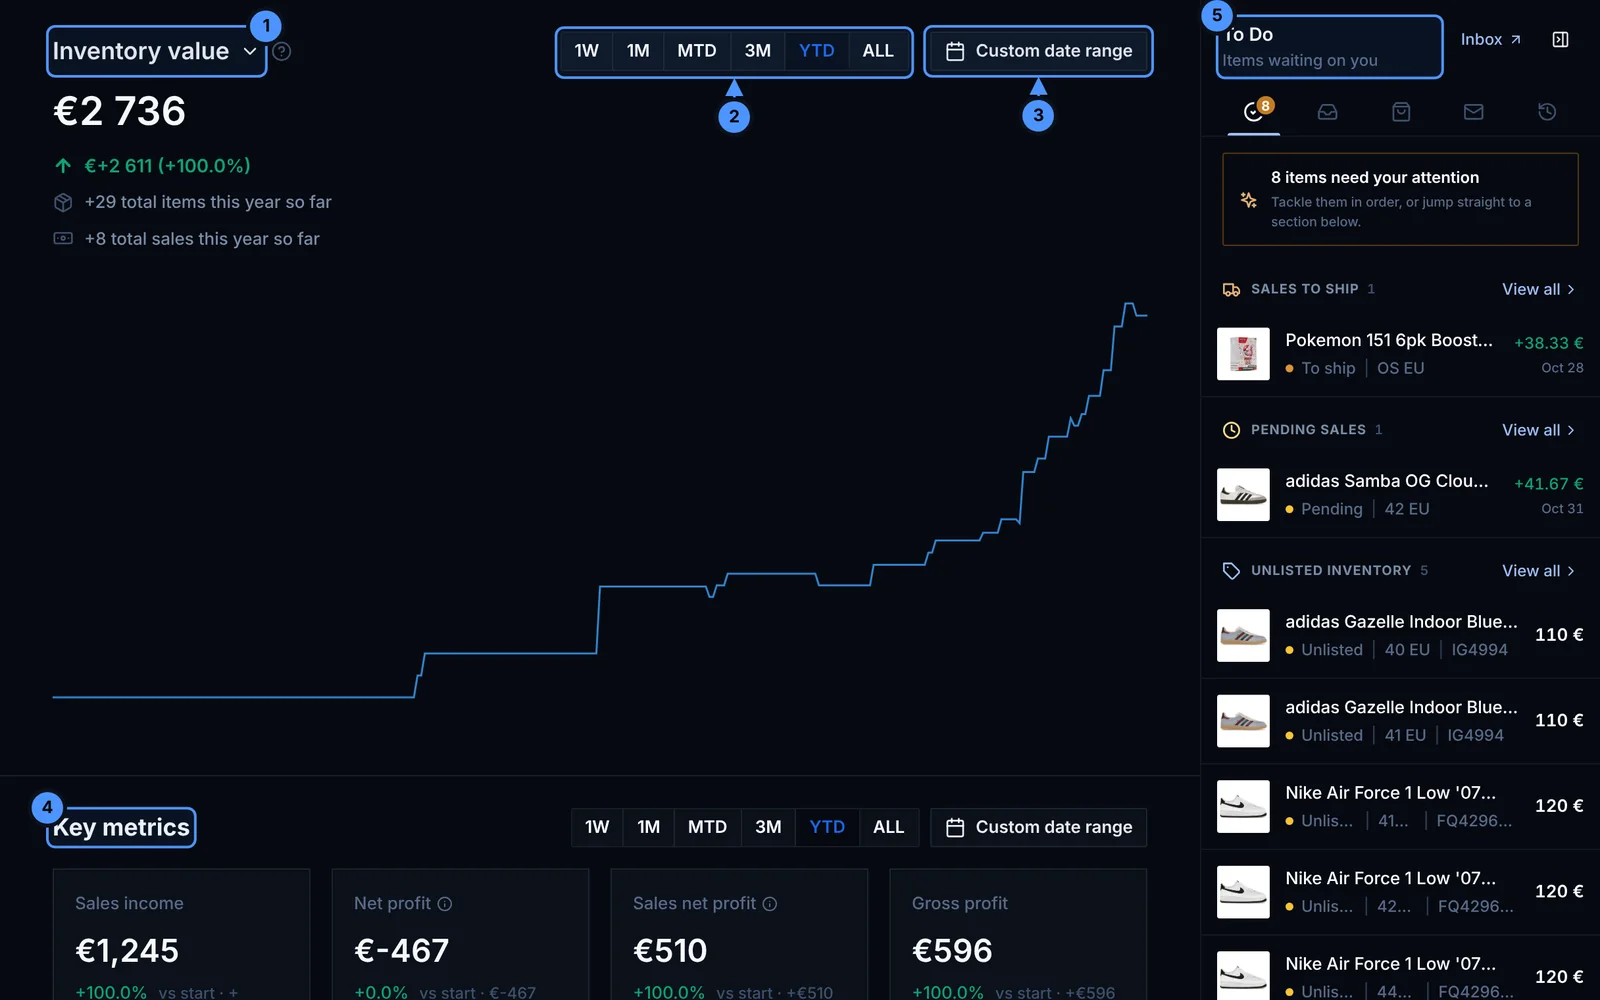
- Pick what the main chart shows.
- The period: one week, one month, month to date, three months, year to date or all time.
- Or pick your own dates.
- Key metrics for the same kind of period.
- The To Do panel: what's waiting on you.
Main chart
The big number at the top is your inventory value by default. Click its name to chart another figure. Pick a period with 1W, 1M, MTD, 3M, YTD or ALL, or set a custom date range. The change for the period is shown under the number.
Key metrics
| Metric | What it measures |
|---|---|
| Sales income | What buyers paid you in the period |
| Gross profit | Sales income minus what the sold items cost you |
| Sales net profit | Gross profit minus platform fees, shipping and tax on those sales |
| Net profit | Sales net profit minus your expenses and subscriptions |
| Inventory value | What the stock you hold is worth |
| Sales count | Number of sales |
| Avg. purchase cost | Average cost of the items you bought |
| Sell-through rate | Share of the stock you bought that you've sold |
| Inventory turnover ratio | How many times your stock turns over in the period |
Each card compares the figure with the start of the period.
Your reports
Under the key metrics, Your reports holds charts you choose. Use + to add one and the settings button to reorder or remove them. Each one can be downloaded.
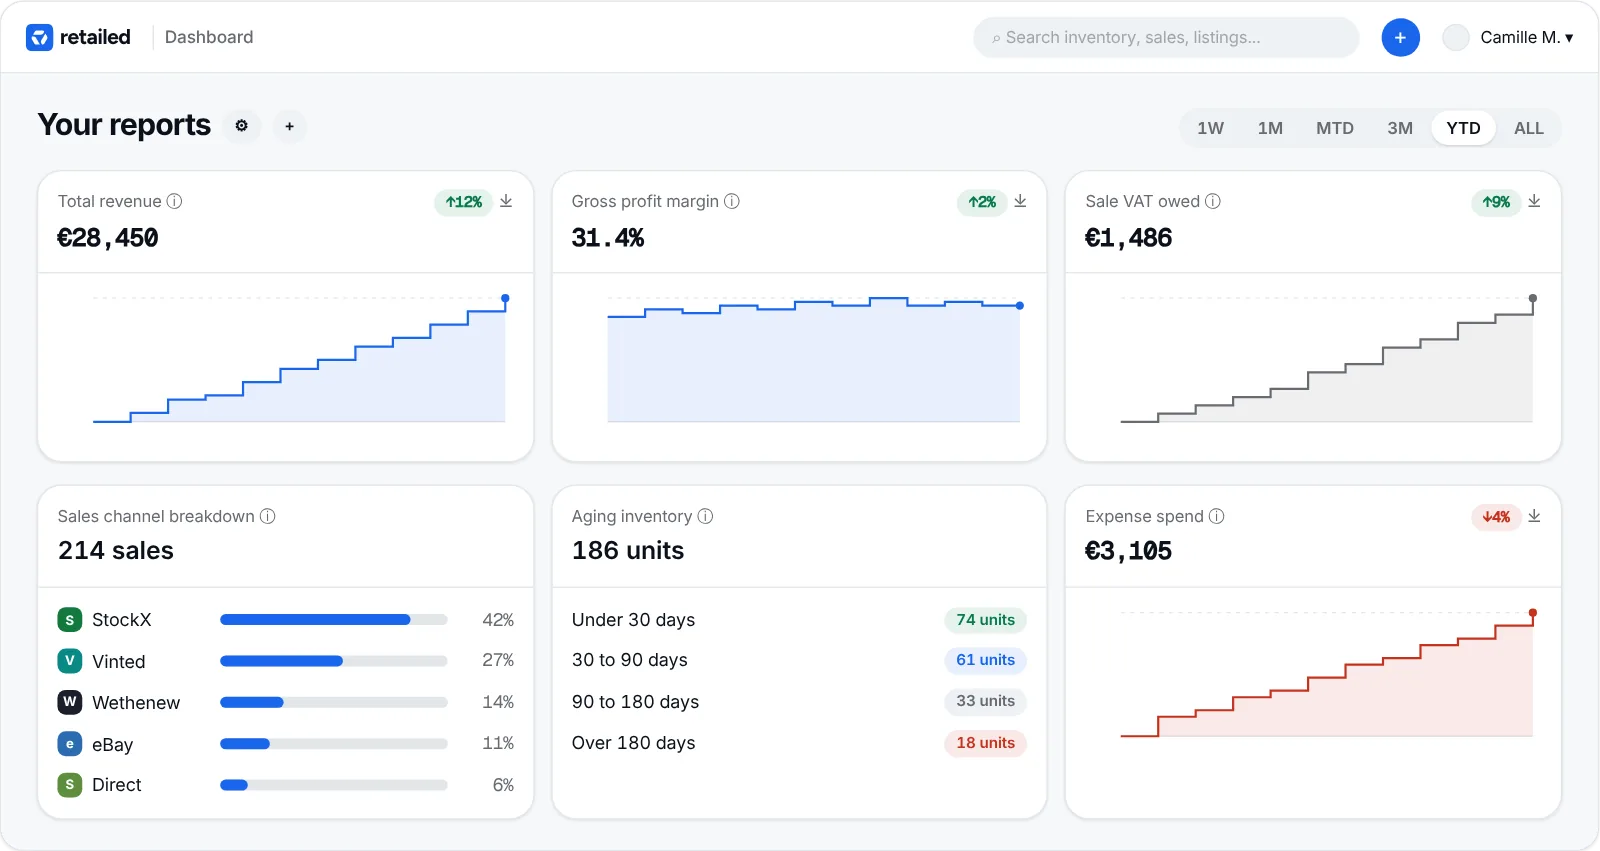
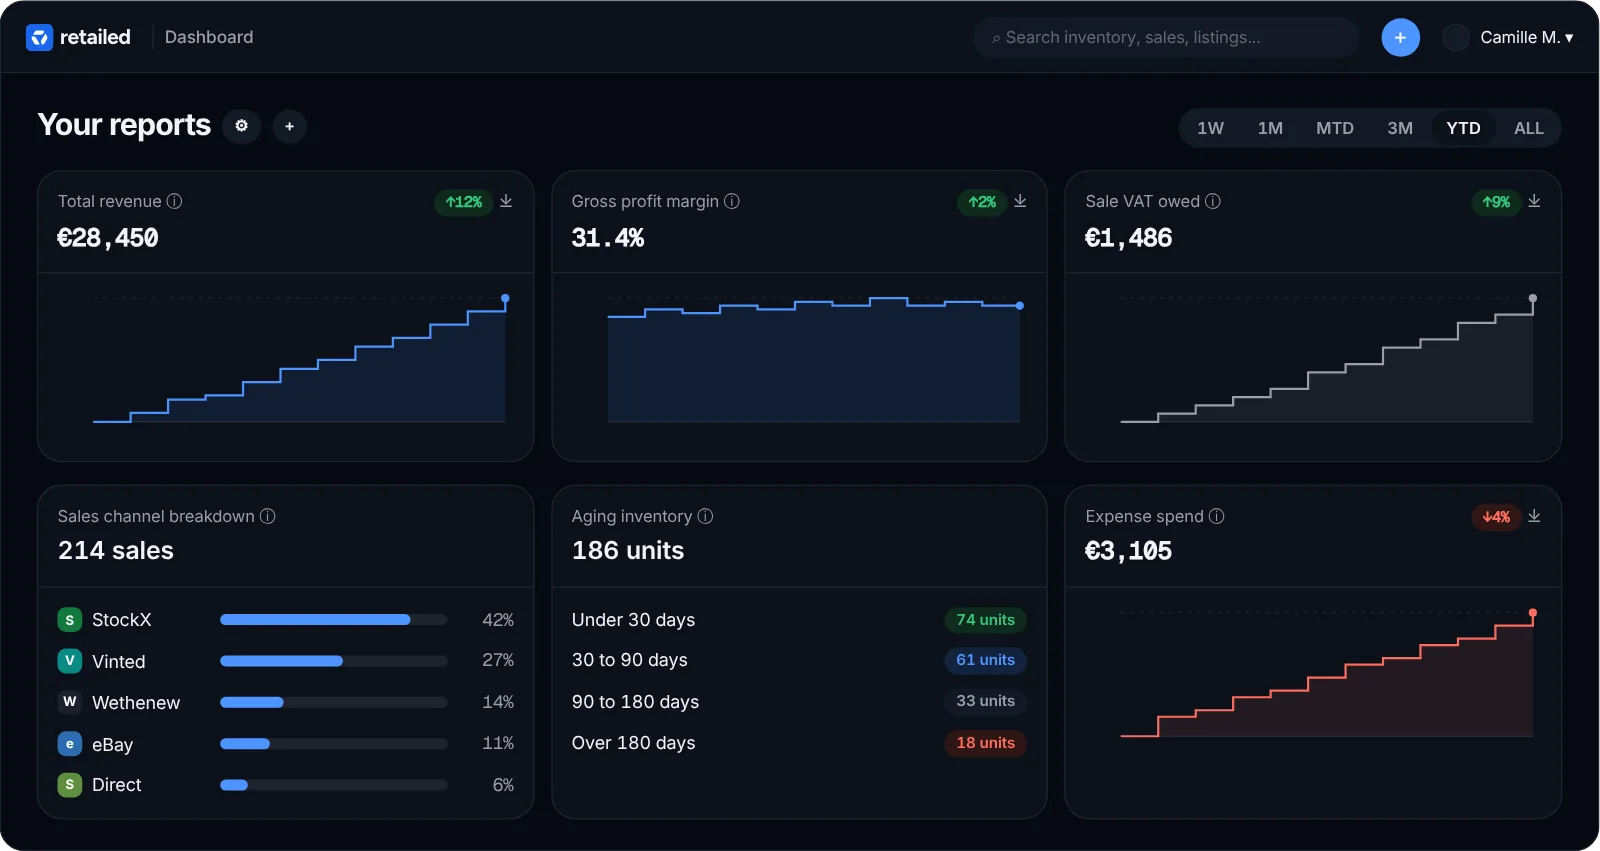
The reports include:
- Money in and out: total revenue, cashflow, global profit, cost of goods sold, gross profit and margin, net profit margin, average sale price, average order value, average ROI
- Costs: expense spend, subscription spend, total spend, shipping costs per order
- Stock: total inventory cost, stock value at cost and estimated, items purchased, aging inventory, inventory turnover, sell-through rate
- Tax: VAT or sales tax owed on sales and tax you can deduct
- Channels and customers: sales channel breakdown, CRM size, number of contacts and companies
To Do panel
The panel on the right lists what's waiting on you: sales to ship, pending sales and packages in transit. Its tabs show your inbox, recent sales, emails and history. Collapse it with the button at its top right.