Analytics dashboard
Easily monitor your reselling business performance
Monitor your reselling business performance with our Analytics Dashboard, driving data-driven decisions.
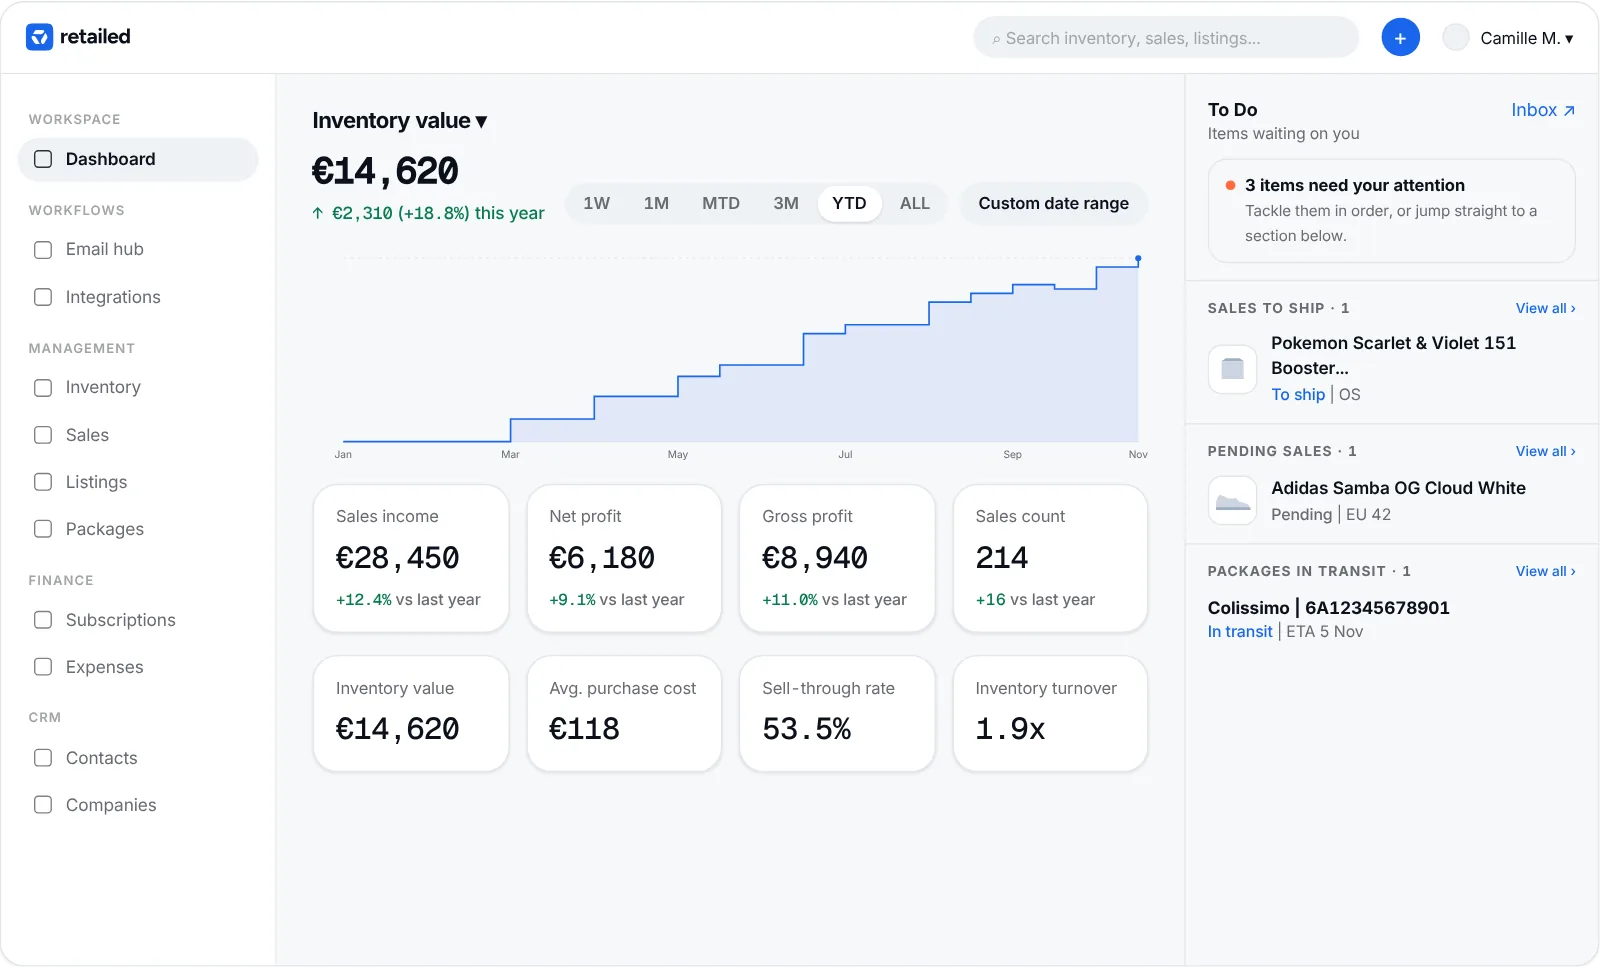 Example data
Stock value at a glance
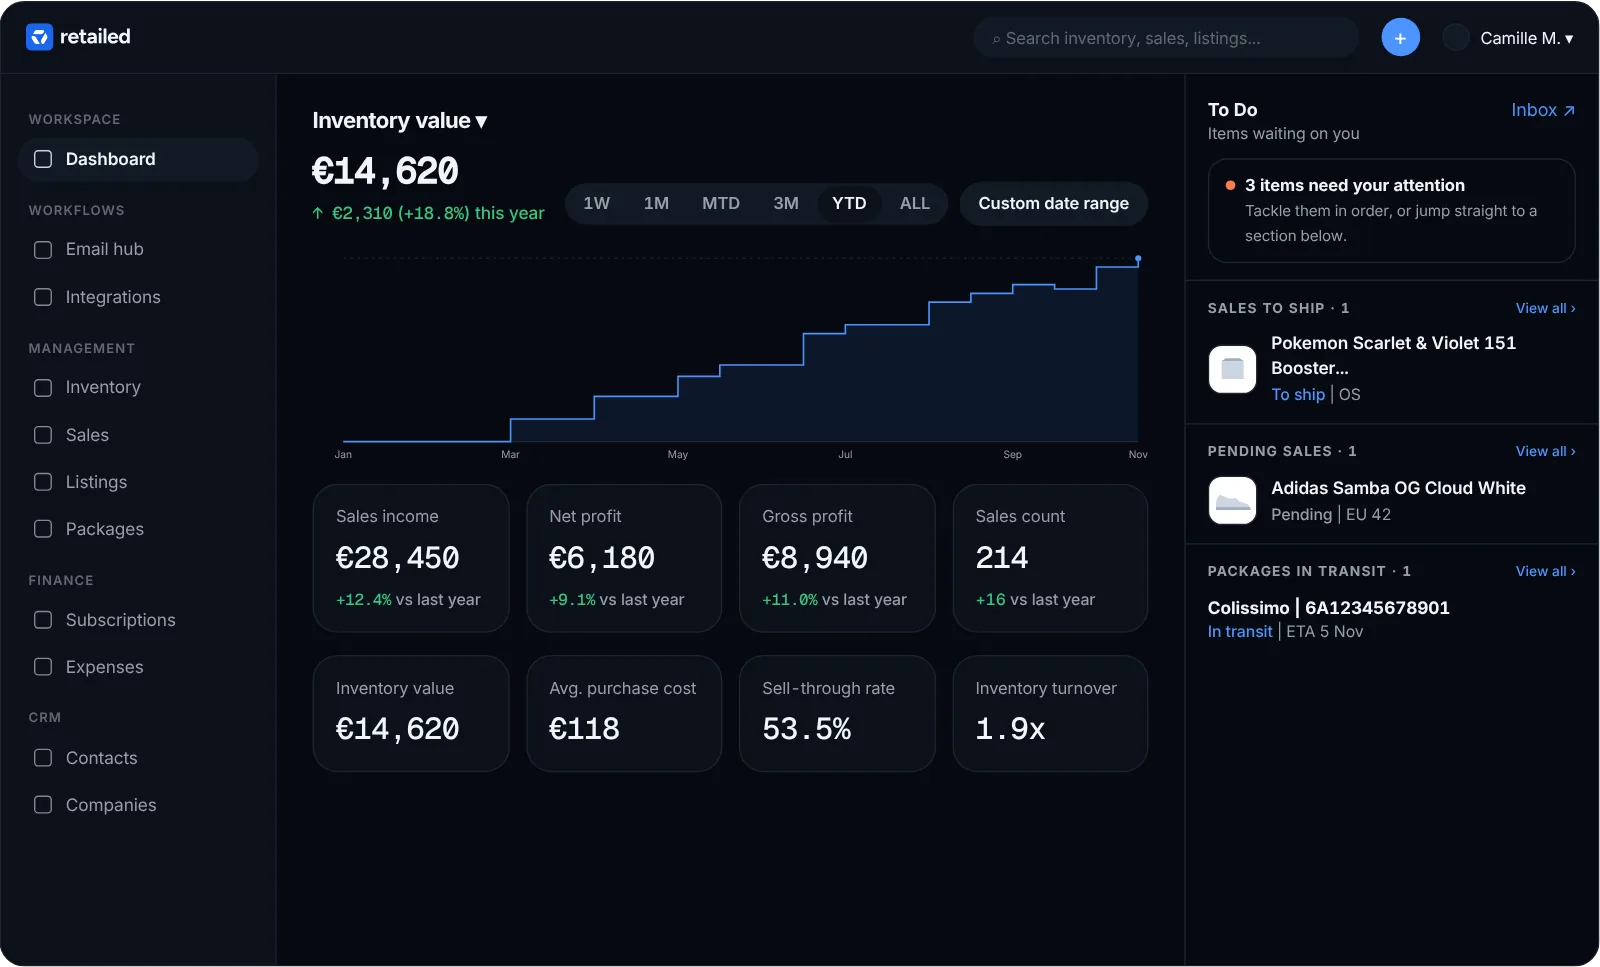
The main chart shows what your stock is worth. Switch it to any figure and any period.
Profit after every cost
Gross profit, profit after platform fees, and net profit after expenses and subscriptions.
Ready for your accountant
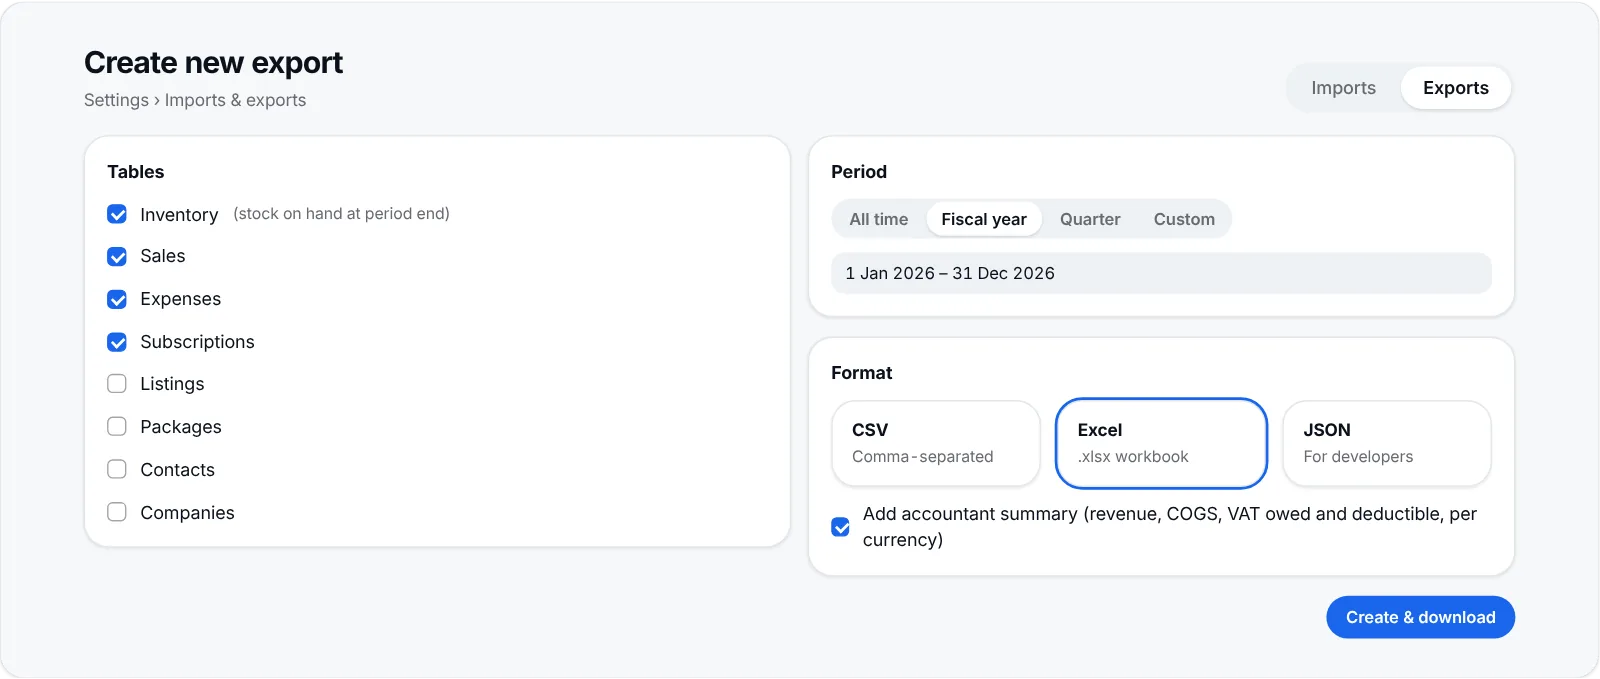
Export to CSV, Excel or JSON with a summary of revenue, costs, profit and tax.
The numbers that run a reselling business
Each card compares the figure with the start of the period: one week, one month, month to date, three months, year to date, all time or your own dates.
- Sell-through rate and inventory turnover
- Average purchase cost
- A To Do panel for sales to ship and pending sales
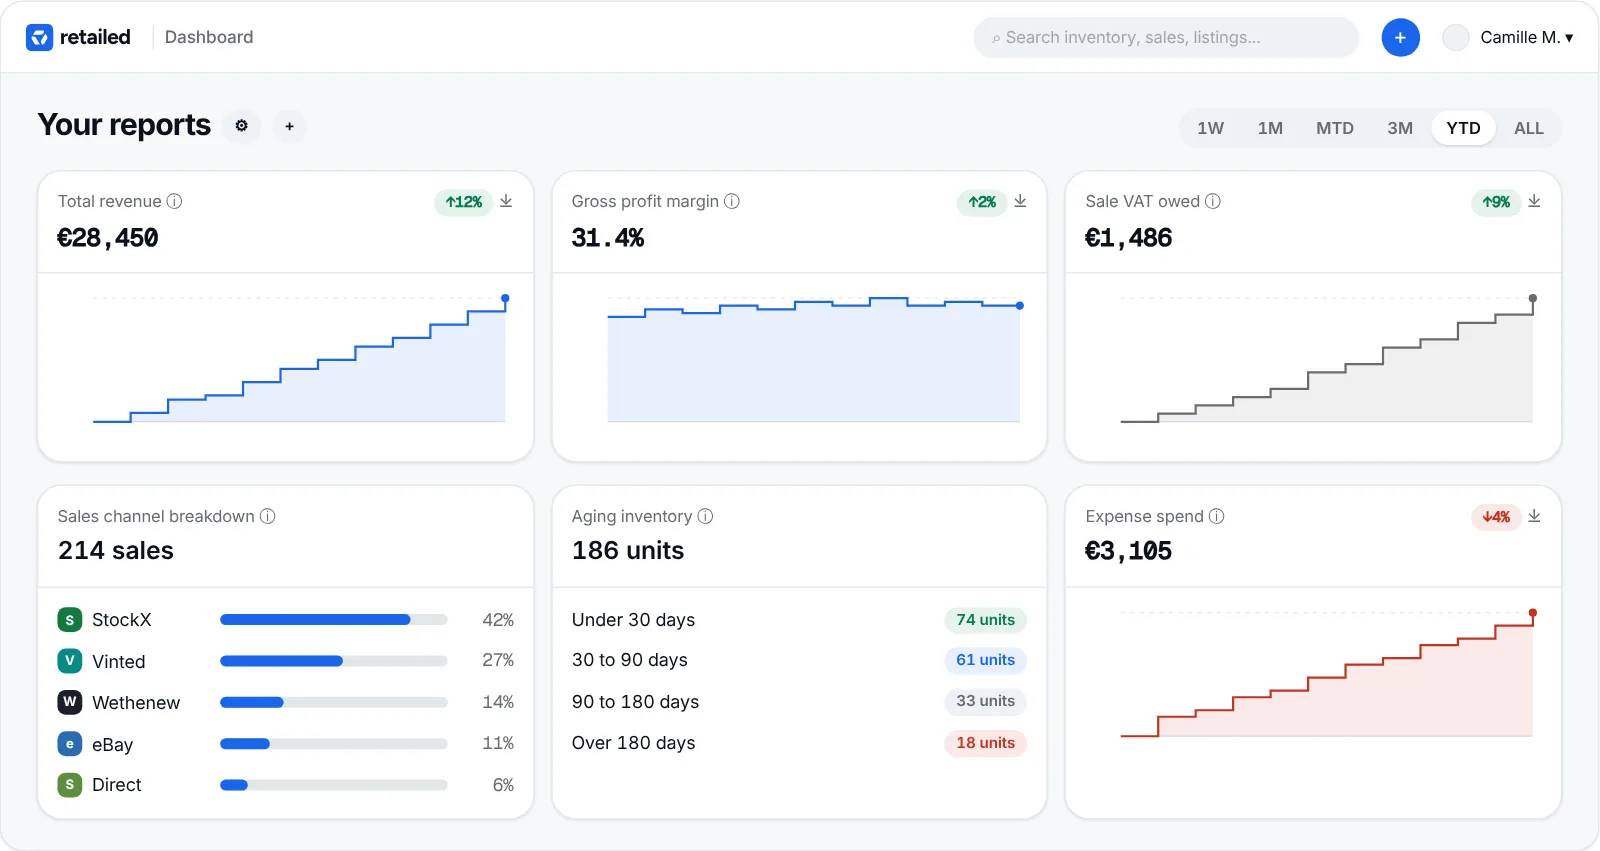
Build your own report cards
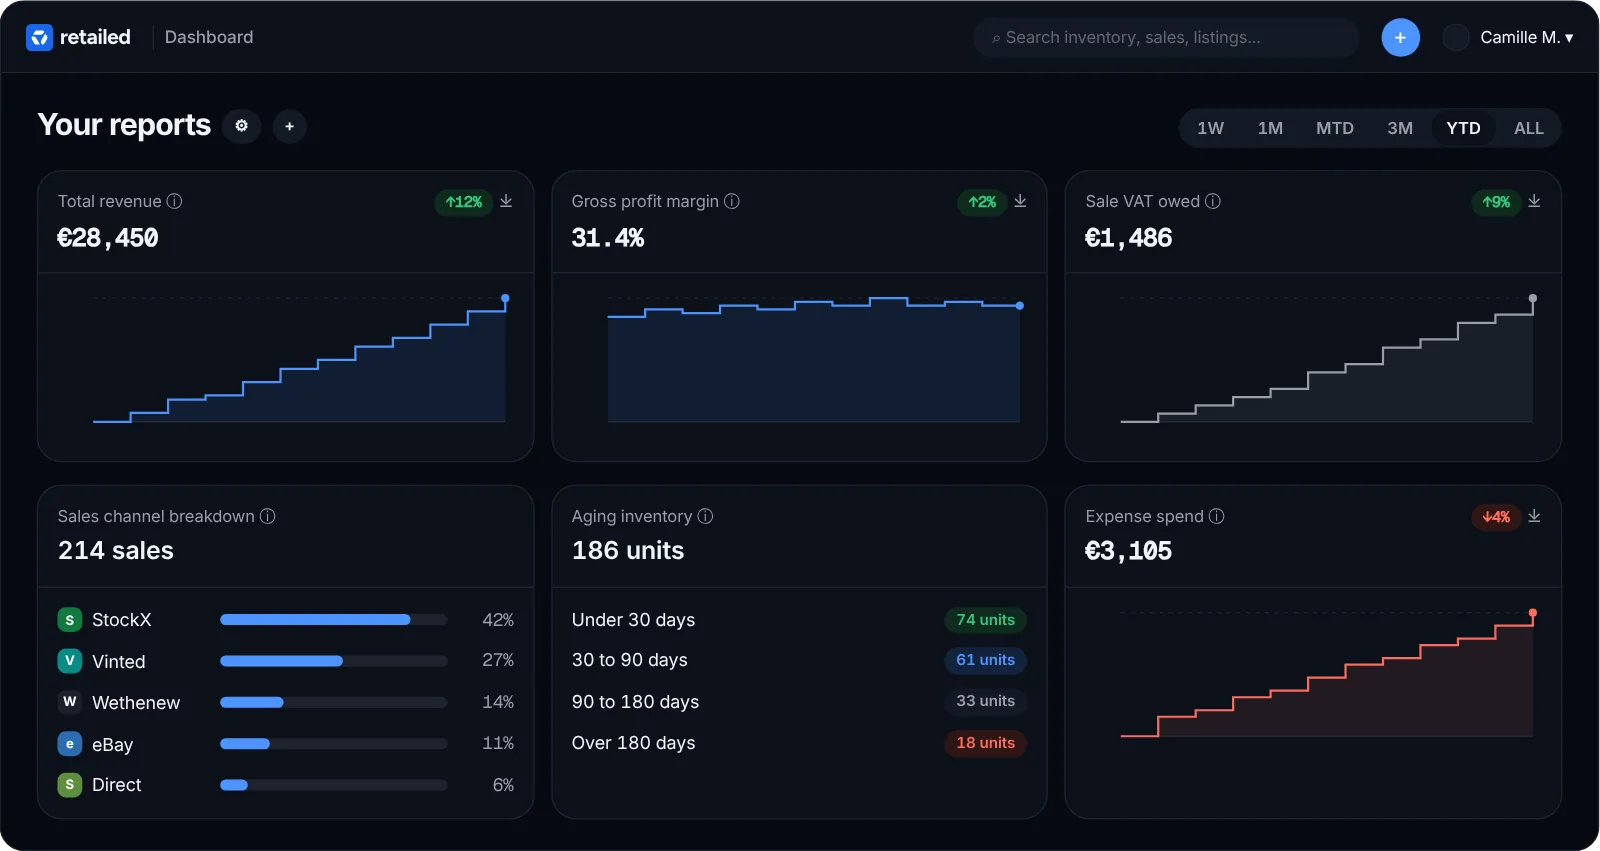
Under the key metrics, add the charts you want, reorder them, and download any of them.
- Money in and out: revenue, cashflow, margins, ROI
- Stock: aging inventory, turnover, sell-through rate
- Tax: VAT or sales tax owed and deductible
Exports your accountant can read
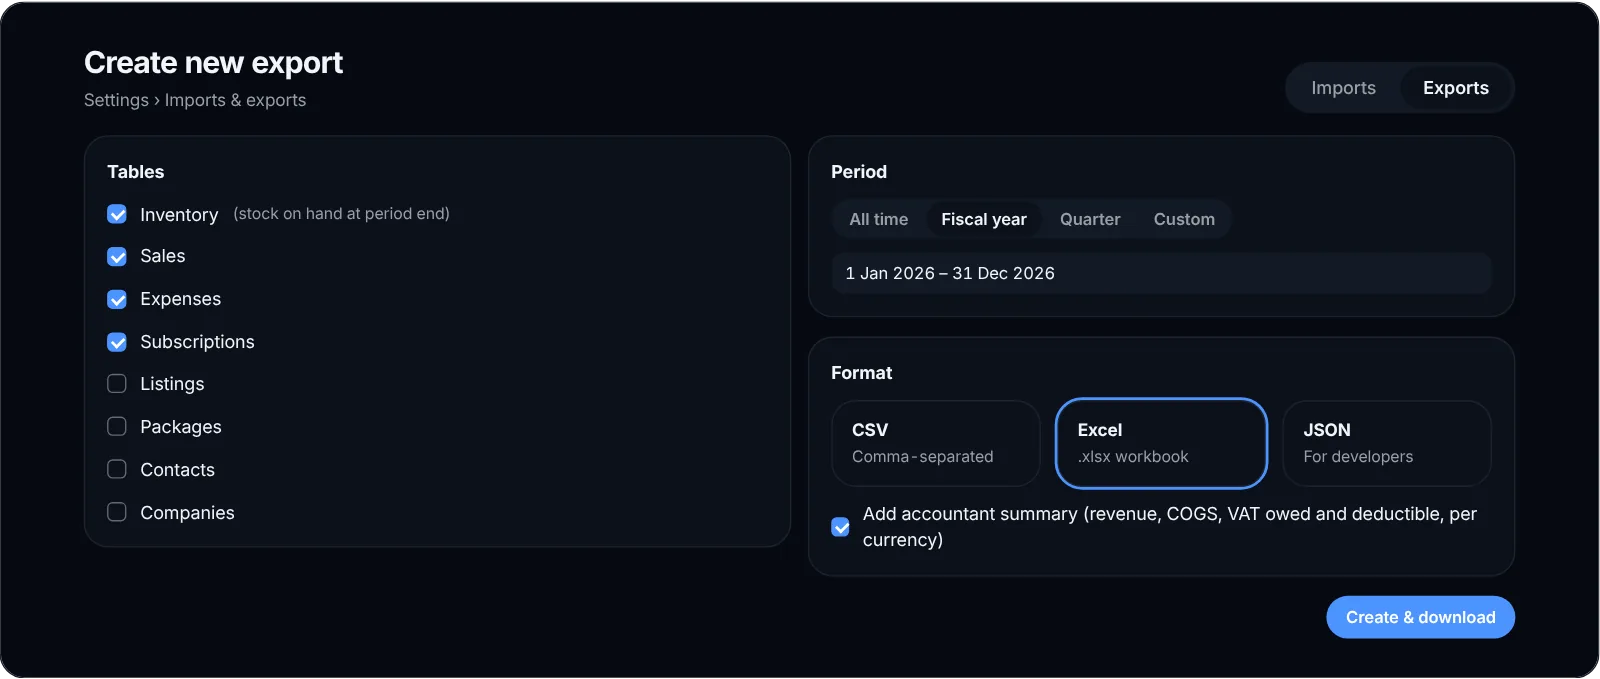
Pick the tables, the period and the format. Each export comes with a summary of revenue, cost of goods sold, profit and tax, per currency.
- Inventory, sales, expenses, subscriptions, contacts
- All time, a fiscal year, a quarter or custom dates
- Exports are part of paid plans
- Inventory & Sales managementManage your inventory and track your sales
- Listings oversightRecord where your items are listed
- Expenses & SubscriptionsKeep track of all your business liabilities
- CRM for Contacts & CompaniesStore your customers & suppliers in one place
- Public inventory sharingShare your reselling inventory to the world
- Email HubDynamically update your items with emails
- Parcels trackerTrack your incoming & sent packages